
The Grasshopper–Tekla Live link integration enables companies to accelerate and automate their BIM workflow. StudioFG helps organizations unlock the full potential of this technology—even without in-house Grasshopper expertise.Continue readingGrasshopper–Tekla Integration: Save Time and Costs
Computational Design
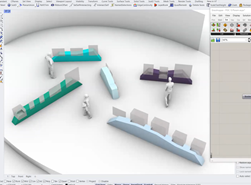
In this example, we see a slightly more elaborate design. As with proof of concept #1, we organize objects spatially along walls. This time the exhibition walls are more elaborate. Color based on number of walls Number of walls based on layout Width and shape of walls based on objects Random function to generate unpeaked number of results Live connection to Airtable The Kanban interface of Airtable does help to make sorting elements more intuitive, but sorting within a gallery is not persistent. This means that the order in which we see the objects in Airtable is not necessarily the…Continue readingProof of Concept #7 | Parametric exhibition design using Airtable
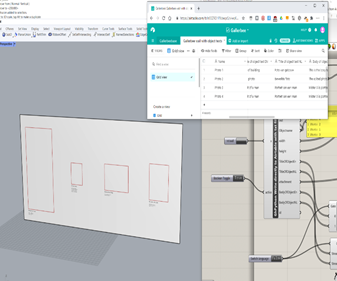
A time-consuming part of many exhibitions is the hanging plan. This demonstration shows how object texts in multiple languages can be stored in the database. These texts can then be loaded into a design software and immediately implemented into the design. When the text in the table is updated, the text in the design file is also updated. Here the text attributes are used for graphical elements, but they could also be implemented in multimedia experiences such as projections or apps that accompany the presentation. With this we see that an update in the text can be incorporated into the…Continue readingProof of Concept #6 | Multilingual object texts from Airtable to a hanging plan
So far Excel has been used in the examples but in this demonstration we will see how to use the more comprehensive online database system Airtable. Airtable is currently used by the chief curators of the Barbican Centre in London for exchanging data and managing traveling exhibitions. I was shown this in an interview with them that was part of the field research for this Gallerbee project. I had the opportunity to see how they work with this system and the kind of data and connections they keep. The connections they make between different data sets were also very interesting…Continue readingProof of Concept #5 | Airtable + bi-directional data transfer
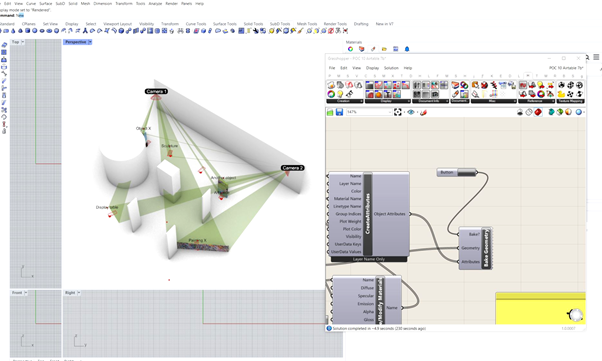
The ability to analyze performance is an important quality of parametric design. Especially during discussions with curators, it became clear how much potential there is in the ability to analyze object data and design data in a parametric setup while using a central database. Several areas of analysis emerged. One can think of: Security: are objects visible by security cameras Insurance: are objects in safe places Logistics: do objects fit, e.g., do the works fit through the entrance But one can also analyze the building itself: What are the most visible places? Which places get the most daylight? Which places…Continue readingProof of Concept #4 | Analyze Visibility
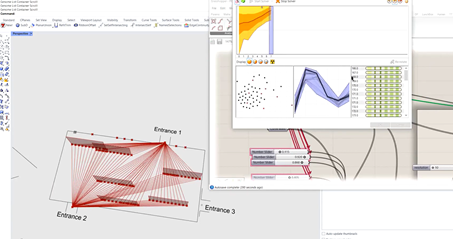
In this proof of concept, we’ll explore an example where we let the computer do the work for us. A parametric algorithm in grasshopper can work as a design tool where the user interacts with sliders and data. But in this example, we will explore a proof of concept where we let the computer present different outcomes. The computer will iterate over many options to present a set of good results to the user. The decision framework is basically designed by the designer, because he/she can dictate to the computer which solutions are preferable. This method can be used in…Continue readingProof of Concept #3 | Maximize visibility with an evolutionary solver
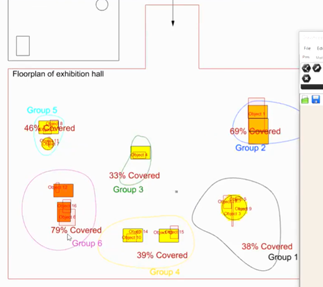
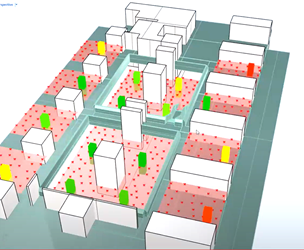
In this concept we see how the same technology can be applied to help organize exhibitions within a more defined setting. Here we see how immediate feedback is generated based on the distribution of objects in an imaginary art exhibition. As in Proof of Concept #1, an online Excel document is connected via Grasshopper to a design in Rhino3D. The situation: A museum has a permanent stock of display tables. A curator needs to divide a collection into groups across these tables. In the 3d model is a storage area with the display tables. Areas are marked in the floor…Continue readingProof of Concept #2 | Layout with a fixed stock of display tables
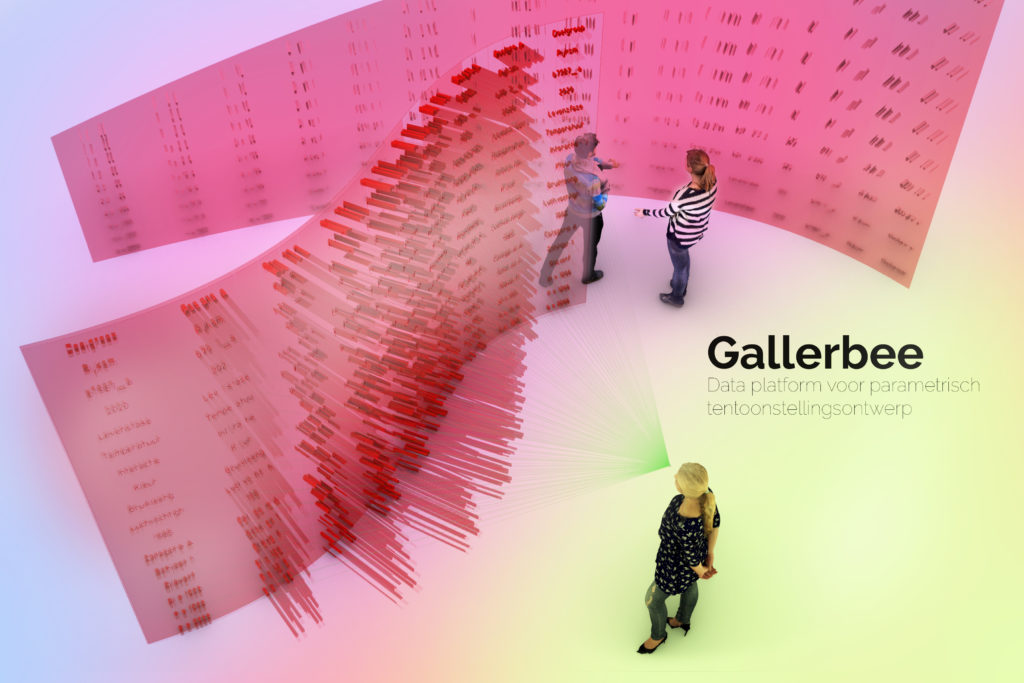
In exhibition design and experience design, the subject is leading and the design is supporting. Based on this philosophy, a parametric approach is appropriate: namely, a strategy in which data from the objects determines what the design looks like by means of algorithms. This could be, for example, a graphical timeline generated automatically from the database, or a number of walls that automatically grow or shrink in the planning phase depending on the layout by the curator, a light show that reacts to data from the database about an artist’s life, or automatically generate wall results with a hanging plan.…Continue readingPreliminary research Gallerbee
For a sail making company, StudioFG has developed several scripts to automatically generate drawings for hems and other fabric parts. Read here about this project.Continue readingAutomatic generation of cut-lines for a boat cover
Categories
eCAADe Workshop
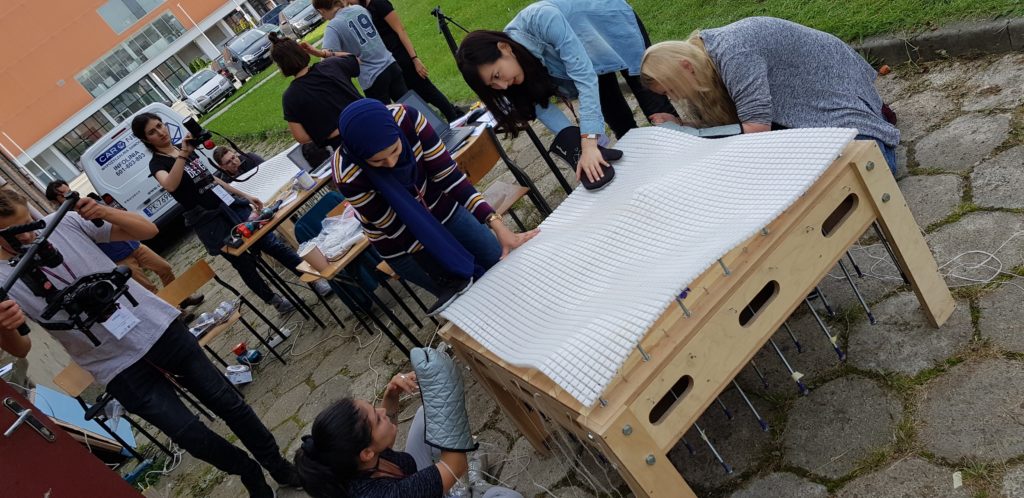
Together with Serdar Aşut and Jerzy Latka StudioFG organized an eCAADe workshop. Design Express / Vectorworks sponsored the event financially and provided the Marionette software (part of Vectorworks). Using a flexmold and PETG panels we created double curved panels. Sponsor: Design Express / Vectorworks. Conference: eCAADe 2018 This 360 video shows the end of the workshop where the participants are hanging the lamps as an ornament on the ceiling. Best viewed in VR / on your phone in the Youtube app: More photos of the project:Continue readingeCAADe Workshop