
An animated version of the exported line drawings is shown above. Top left you can see the original. A is the grid of points that is measured, this can be set denser or less dense. B is the outline variant, D & E are columns and rows, C is everything combined.
The steps:
- The image is divided into points where the brightness is measured.
- Then there are 3 options in the script: horizontal rows made out of circles, vertical rows made out of circles, or an outline of the traced shape.
The rows and columns are all points with a brightness above a certain limit. These are combined per strip.
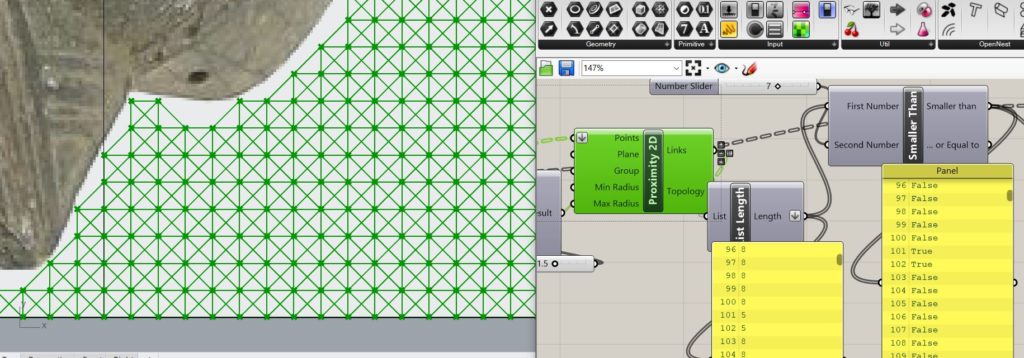
The outline looks at the relationship with points around it. If a point has less than 8 points around it, this point is on an edge. These points are retained. Then an analysis takes place in which the points are sorted close to each other and combined into poly-lines. The points have no relation to each other at first, they are only sorted as the original grid was set up. By flattening the list and looking at the 2 closest neighbors per point, relationships between the points are created and an outline can be made.