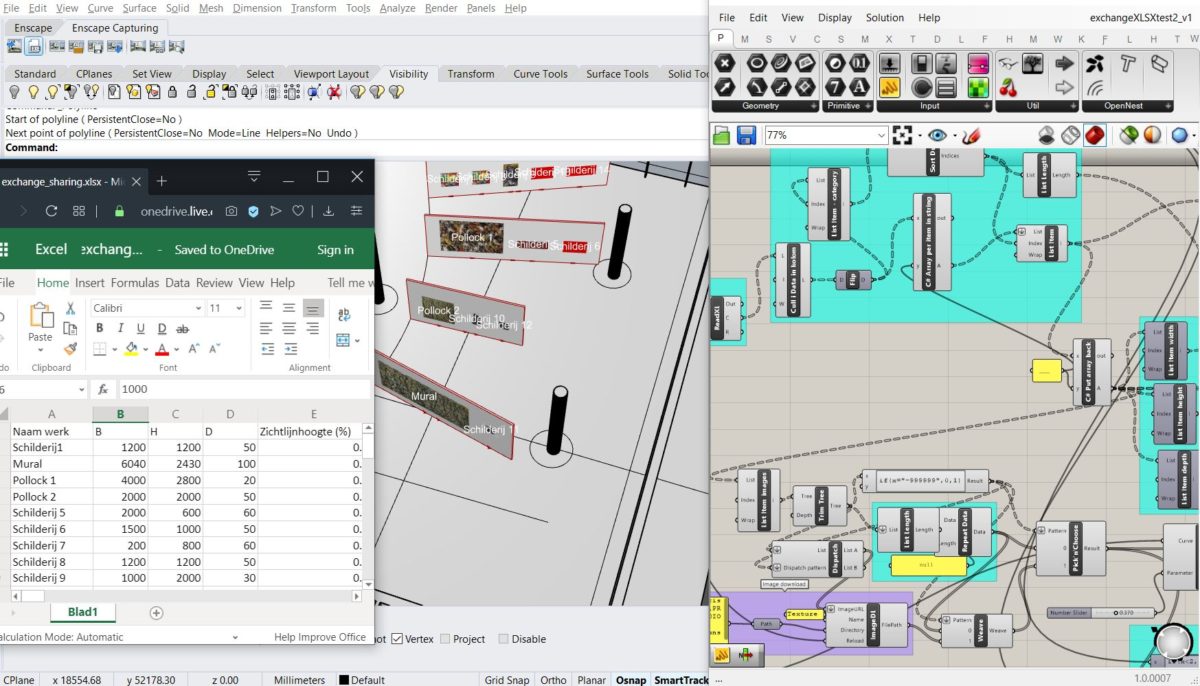
This is an initial Proof of Concept for Gallerbee worked out using an exchange between an online Excel document that interacted with a 3D design via Grasshopper,
Excel was chosen because it is easy to use for initial testing and is a frequently chosen program by exhibition organizations.
The following data can be processed in the Excel table:
- Delete or add artworks.
- Name/rename artworks.
- Change/add dimensions.
- Add information such as year of creation, artist’s name, preferred position from the floor.
- Link to an image file of the artwork.
- And especially important for this test: categorize the works

Naturally, there are many fields imaginable that could be added. But for this test, the above fields are sufficient. The grasshopper algorithm follows a curve in 3D given as input by the designer. It places walls along this line and automatically distributes the objects along these walls. To calculate the length of the walls and the number of walls, the algorithm uses the dimensions and category letters from the Excel file.
When a category is added or removed, a wall will be added or removed.
Say a graphic designer wants to create a pattern on the walls. And in addition wants to create a timeline based on the object data. If we zoom in on a wall, we see these two graphical elements.
So these graphical elements are also generated parametrically. The moment the curator changes the content in the Excel list, the graphic element changes with it.

A grid along the surface of the wall is created with different shades of red. Darker around the artworks and lighter further away from the artworks.
A second element is the curved line that this designer wants to use to create a timeline. The height of the curve is based on the value in column E in the Excel.
A YouTube video of this proof of concept can be found here:
