In this concept we see how the same technology can be applied to help organize exhibitions within a more defined setting. Here we see how immediate feedback is generated based on the distribution of objects in an imaginary art exhibition. As in Proof of Concept #1, an online Excel document is connected via Grasshopper to a design in Rhino3D.
The situation: A museum has a permanent stock of display tables. A curator needs to divide a collection into groups across these tables.
In the 3d model is a storage area with the display tables. Areas are marked in the floor plan.
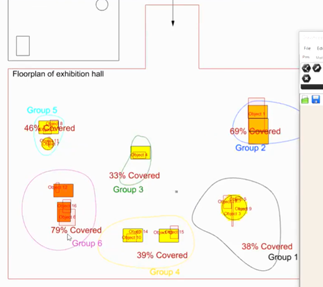
In this example, the objects from the Excel list are distributed among the display tables placed in the floor plan in Rhino. There is feedback on the relationship between the objects and the space on the exhibit displays. As the designer adds or removes tables from the inventory, the colors of the areas change to illustrate the density, giving the designer a quick idea of the distribution.
Of course, there are many other aspects to consider, such as the orientation of the objects on the tables, the distance between the objects, etc. These features would enrich the feedback for the curator and designer and could possibly be integrated into Gallerbee.
A video demonstration of this proof of concept has been published on YouTube here: